Top 10 Enablers For Efficient & Intelligent Data Use

Author: Timm Grosser, Nina Lorenz
"You need a data strategy" is the generic response to enterprise data problems. But what is the scope of an effective strategy and why is it difficult to create value from data? What are the business, technical and organizational challenges that need to be addressed? This post is the second in a three-part blog series, providing insights on how to use data effectively in an era of complex data landscapes and diverse, cross-enterprise use cases.
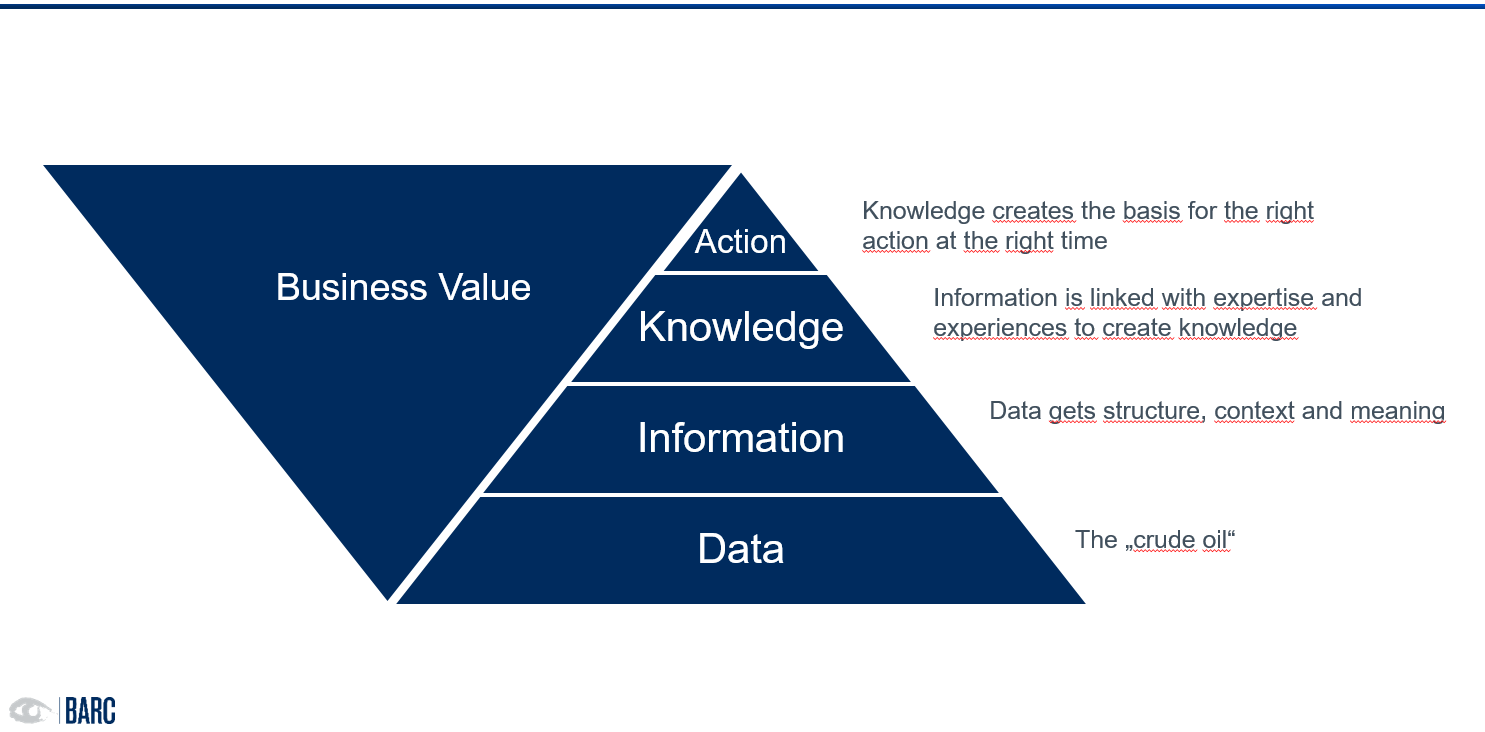
Data alone does not create value, because it does not form the basis for decision-making. In this context, we often hear that data is the new oil. This statement does not simply imply the relevance of data for corporate success. Rather, the statement implies that – just like crude oil – data only becomes valuable after it has been processed.
When does data become useful?
Data goes through a multi-stage refinement process before it can lead to a meaningful, goal-oriented action. When data is placed in context with related data, information is created. These are understandable, relevant, timely.
Creating value from data requires knowledge.
Information is already helpful for some decisions. However, it is far from sufficient for dealing with the complex issues that characterize today's business reality. This is because pure information does not include reliable evaluation and classification. Sound decisions need knowledge. In the context of value-adding knowledge and in relation to data, the term business knowledge is often used. This comprises abilities, experience, skills and expert knowledge created within companies. As a shared resource, knowledge shapes and influences all activities in and around a company. Data can therefore only be of real benefit in context and together with the right business knowledge (Fig. 1).
Let's use the example of a telco company to illustrate this:
The telco company captures and stores their customers' Call Detail Records (CDR) for billing purposes over a period of several years. The individual CDR record (the oil) contains data on the numbers of the call participants, time and duration of the connection, the device, cell tower, and so on. It cannot be used to make any business-relevant statements about customers or revenue. Of course, no decisions can be made with this raw data to optimize one's own business or to add value. Even if the data records are linked with the master data of the customer and the selected tariff, no business-relevant statements - for example, on the profitability of a tariff – can be made yet. Only when other dimensions and aspects such as tariff types, customer types, geo clusters, etc., are put into context with the data, information does emerge that allows some meaningful evaluation of user behavior. However, if the company wants to find out which customers are likely to leave or buy more services, it has to rely on the knowledge of the employees.
They:
- know which measures are potentially successful, taking into account their experience,
- are able to draw appropriate conclusions from customer conversations,
- are able to assess whether customers have been dissatisfied for a long time or have made complaints,
- can assess how serious these complaints are.
Only when this knowledge is taken into account, can decisions (actions) on tariffs, upselling opportunities, etc. be made.
Empirical knowledge: Why isn't knowledge self-evident?
Making good use of data goes beyond simply collecting and processing it. We know from BARC studies that companies have particular difficulties here.
Our global study Data Black Holes - Are Data Silos Undermining Your Digital Transformation (June 2021) comes to a clear conclusion: Companies that infuse data with knowledge and meaning use data more successfully. This is due to the shared understanding of data, interpretability, and available knowledge on context and usage.
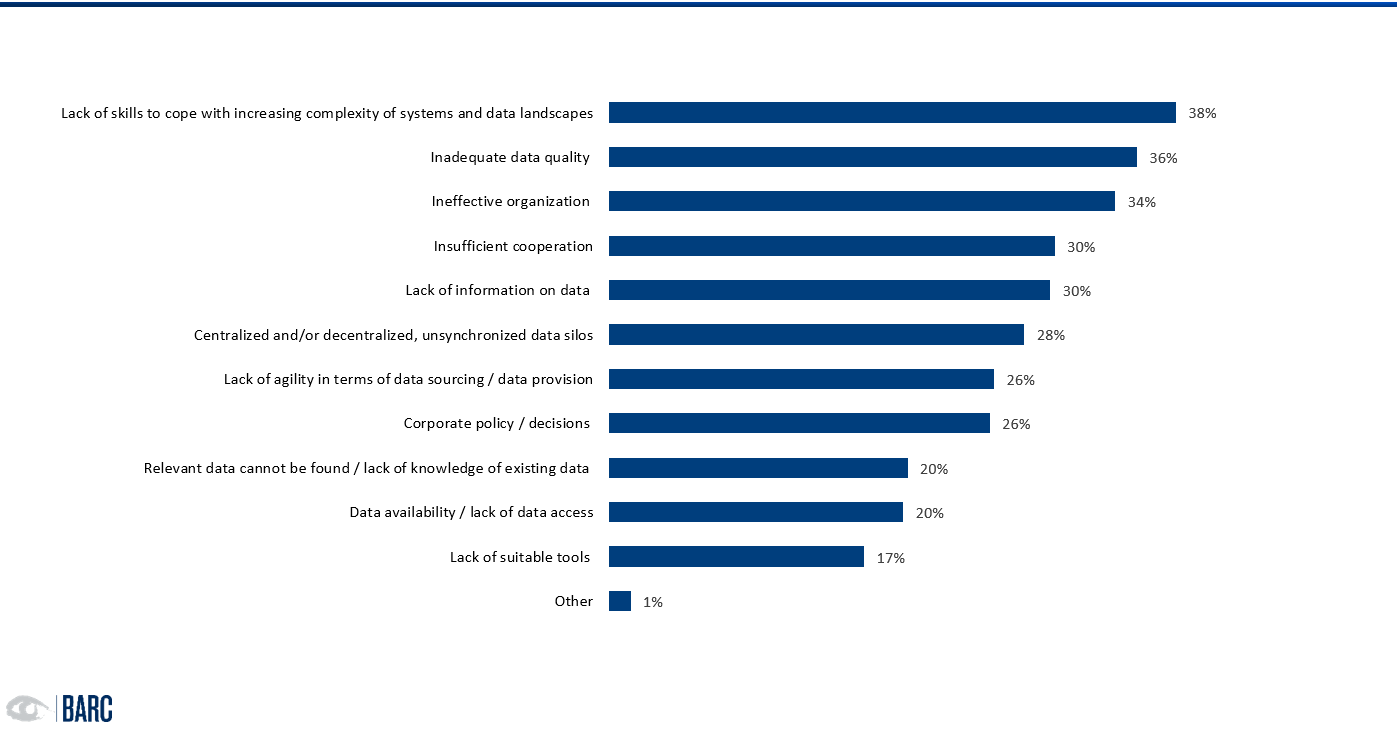
However, linking knowledge with data is anything but trivial. Data landscapes are heterogeneous and complex, and organizational barriers are often high. It is not uncommon for companies to lack structures, know-how or simply the commitment of management to invest in the appropriate and necessary infrastructure and resources (Fig. 2). Furthermore, there is usually a lack of transparency about the effect of good and bad data on decisions. These aspects have been the top challenges in data management for years. A number of BARC studies confirm this, e.g., Leverage your Data (2020), How to Rule Your Data World (2018). What is new, however, is that these challenges are perceived as more detrimental to a businesses’ success. This is also clearly noticeable in the increasing number of projects aiming to specify data strategies.
Still, the list of issues companies face when working with data is long.
Even those who rate their company's data handling skills and competencies as significantly better still struggle in various data-related areas. The reasons most frequently reported are (Fig. 3):
- lack of expert knowledge and understanding of data
- difficulties in data preparation and integration, caused among other things by poor data quality and lack of data availability
- lack of usability of the analyzed data in business processes, often due to lack of data understanding and expert knowledge
This has implications for the stability and efficiency of existing data-based processes and the innovation power of the company.
Now for the good news
There are solutions. We already introduced them in the last blog post. Now we would like to get more specific. We point out which ten relevant functions a solution must provide so that data can be found, understood and used.
How can technology be used to infuse data with knowledge?
Without a data culture that sees the linking of data, meaning (semantics) and knowledge as the ultimate good, however, the best data management solution is of no use. In addition, a data strategy that is aligned with this culture and the promotion of the corresponding know-how in the company are essential. We would like to preface this as thesis. Describing data and linking it via metadata with knowledge (about the data, methods, use, etc.) requires tool support.
Tools can help to encapsulate complexity, to create access to data and to decisively increase the acceptance for working with and maintaining data. In our view, sustainable efficient data use requires a tool that helps to link and manage data and knowledge as well as make it traceable and usable. A tool should therefore address the following top 10 business requirements:
- Findability and data understanding. Data must be uniquely identifiable beyond the systems in which it is stored and used. In addition, it must be linked by metadata to a comprehensible description so that each person understands exactly and correctly what that data means. Key to this are terminologies and ontologies that create a common, shareable understanding about data. A definition and efficient governance to ensure compliance with standards are essential for this to happen. The relevance of a shared understanding of data and its value to the business is demonstrated by the BARC study referenced above, "Data Black Holes - are data silos undermining digital transformation?"
- Trust in data through transparency. Data users must be able to trust both the data and the context information. Therefore, easily comprehensible and accessible documentation of the origin, generation, nature, use and responsibilities of the data is required (lineage). This is also done via metadata. The best-known functional requirements here are data profiling (data quality analysis) and data lineage/provenance/impact analyses, as well as user ratings.
- Seamless integration into existing systems and processes. Seamless integration into the existing ecosystem and the familiar workplace promotes acceptance and efficiency in use. Integration is the key in increasingly heterogeneous system landscapes with the simultaneous desire for access to data that is as consistent as possible. "Yet another new tool" is often met with aversion from users. The key lies, among other things, in the ability to integrate into the existing system and process landscape ecosystem and in the simplicity of the application (point 10).
- Connectivity to data sources. Existing systems need to be connected as easily and quickly as possible to read metadata and data. The interfaces should also be robust against changes. Connectors that support the connection of highly complex sources (e.g., applications with encapsulated data such as SAP) are particularly helpful. Crawlers also help to generate information from unstructured data, e.g., Python, Java code.
- Extensibility and adaptability of the solution. No two companies are alike. In addition, a highly dynamic market requires rapid adaptability. In this context, rigid structures can become a challenge. Instead, companies demand an open and freely extensible platform. This means, above all, the extensibility of the model as well as functional scalability. For example, a tool must be able to integrate new data or knowledge objects and attributes easily and without much effort. It must also be open, interconnectable, and documented. Finally, it should be possible to adapt the data schema as quickly as possible and with little effort in the event of changes to the business model or new business models. In our experience, there is little demand for the use of predefined content. Rather, it is important to provide a model that helps to flexibly bring together the different perspectives and terms of the stakeholders. For example, controlling, sales, marketing, development and external companies use data in different ways and also use their own terms. Depending on the department, e.g., customers are sometimes referred to as new customer, prospect, lead, follower, permanent customer, or client.
- Automation. The ability to automate processes reduces the burden on users and promotes the acceptance and benefits of the solution. Automation in turn only works with trust in the data (point 2). At the same time, it represents the greatest potential in terms of cost and time optimization: from the set-up and administration of the knowledge portal, through the identification, extraction, enrichment and linking of the data, to the actual use. Subtasks that can be automated range from the extraction of machine-generated metadata to the solution of complex tasks, such as the linking of knowledge with data or the technical description of data, which is currently often still done manually. The requirement here is to keep the effort for documenting the data as low as possible for the users.
- Creating and sharing knowledge. Nowadays, describing, linking and adding knowledge to data are often manual activities. The aim is to implement a fast, simple transfer of knowledge. To do this, implicit knowledge must be transformed into explicit knowledge. This means that it must be digitized from the heads of the experts - in a way that is both comprehensible to humans and machine. The tool should support different approaches to capturing knowledge for this task: both centrally by a principal person as well as decentrally by the entire workforce (crowd wisdom). A tool can support the motivation of employees, e.g. with gamification features. In any case, it should offer an intuitive and simple way (point 10) to quickly find one's way around the data, to be able to analyze it (in terms of relationships, connections), and to offer simple workflows such as an approval process. It must be integrable into the internal processes and thus ideally be able to capture knowledge right where the data originates (points 3 and 4).
- Correct and comprehensive data use thanks to collaboration & governance. Communication and collaboration are success factors and an essential part of capturing knowledge about data. Thus, comments on data, warnings, hints, usage tips, etcetera should be part of any solution to share transparency on the use and usage of data or information objects. Chats, email notifications, forums or workflows can be supportive. Traditional governance disciplines such as policy management ensure that the use of data, metadata (used to map knowledge) and the tool is consistent and accurate.
- Compliance with enterprise-wide security and privacy policies. The ability to comply with security and privacy policies is essential. This includes several facets: Data access (access management and authorization), seamless integration via single sign-on (SSO), encryption of communications (e.g., via SSL), data privacy (masking, anonymization), and classification of data according to security classification. Clear, transparent rules and control over Security & Privacy are a frequent request from our customers.
- Simple, intuitive usability for everyone. Finally, the tool must offer maximum usability. The answer to a question must be available in an individually understandable and clear language, regardless of whether a manager, a business user, a developer or a technician or even a machine has asked the question. This applies to both the search in metadata and the actual data access. The tool must be very easy to use and help users to find their way efficiently through the world of data. Why has Google become so successful? That's right, they combined knowledge with data in a form that can be understood by any person.
What digital pioneers have in common
Especially when it comes to linking data to knowledge, the term data catalog often comes up. Knowledge Graphs offer a highly appealing approach as a tool for data catalogs and beyond. To be sure, the technology is still relatively invisible in companies historically shaped by relational technologies. However, this is mainly due to corporate cultural reasons. As a result, the potential for Knowledge Graphs is often misunderstood.
Efficient data use requires a tool
that helps to link and manage data and knowledge
as well as make it traceable and usable.
An indication of the potential is provided by the prevalence of knowledge graph technology among digital pioneers and data companies such as Facebook, Amazon, Google, Alibaba, but also banks such as Morgan Stanley and media companies such as the BBC. In my estimation, most companies have not yet fully realized and understood the potential of Knowledge Graphs. The use of Knowledge Graphs should be examined, especially by BI and analytics experts, but also by infrastructure and product management.
Because when it comes to linking knowledge and data, Knowledge Graphs provide a well suited approach. They make it possible to describe the context and relationships between data objects in the company directly on the data. By linking the context to the real data via metadata, the graphs make data readable and interpretable for humans and machines alike. Model logic avoids inconsistencies in the meaning of data and can spare analysts from unnecessary data preparation or communication loops. On the other hand, there is non-SQL expert technology with special interfaces that at first can seem complicated for the integration into the existing ecosystem or the use of SQL-oriented analysis tools.
However, we think there is a lot of potential for Knowledge Graphs as a valuable addition to data and knowledge management.
In the final part of this blog post, we will show how data projects can be successfully implemented and explain the relevance of data availability.
——————————————————
Nina Lorenz is Analyst for Data & Analytics at the Business Application Research Center (BARC). She is co-author of blogposts, articles and research studies within the field of data & analytics. She is also responsible for the concept and implementation of the power BI, Azure Analytics and Qlik content browser. Currently, she is exploring how different organizational structures are influencing and potentially enabling data culture in the data-driven business.
Timm Grosser is Senior Analyst Data & Analytics at the Business Application Research Center (BARC). His expertise includes strategy definition, concept development and software selection for Data & Analytics with a focus on Data Management & Data Governance. He is a respected speaker and author and has been consulting companies of all sizes and industries since 2007.